The INRAE-CIRAD-AFZ feed tables contain chemical data, nutritional data and environmental data of feeds for ruminants, pigs, poultry, rabbits, horses and fish (salmonids). They include values about more than 200 feeds of plant and animal origin and 100 mineral sources. These tables are the result of a collaboration between INRA (now INRAE), CIRAD and AFZ. They update the Tables of composition and nutritional values of feed materials published by INRA and AFZ in 2002-2004.
- Feed profiles
- Parameter profiles
- Tables per feed and parameter categories (as fed basis)
- Tables per feed and parameter categories (dry matter basis)
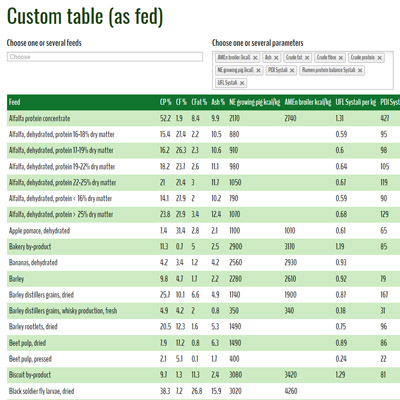
- Custom tables (as fed basis)
Units
Table values are presented on an as fed basis, on a dry matter basis and on an other basis.
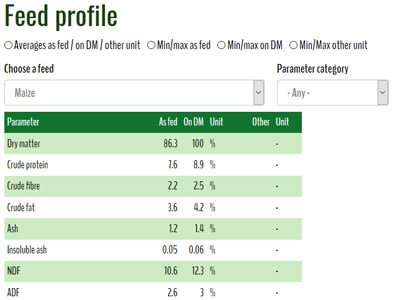
- As fed basis and dry matter basis: parameters such as chemical composition parameters (crude protein, crude fibre...), energy values (digestible energy, metabolizable energy, net energy...) and digestible/bioavailable components (digestible amino acids, digestible phosphorus) are expressed in a unit relative to feed weight: %, g/kg, mg/kg, kcal/kg, MJ/kg. They can be presented either on an as fed basis (relative to the total weight including moisture) or on a dry matter basis (relative to total weight minus moisture = dry matter). For instance, the crude protein of maize grain is 7.6% when expressed as fed basis and 8.9% on a dry matter basis, assuming a dry matter content of 86.3%.
- Other basis: parameters such as digestibility coefficients are expressed only in units that are not relative to feed weight and this expression is thus independent from the dry matter content.
Some parameters, such as amino acids, fatty acids and digestible amino acids can be expressed both on weight-based units (as fed and dry matter) and on non-weight units. Such parameters include notably:
- Amino acids: g/kg (as fed or dry matter basis) and g/16 g N (which corresponds to % of crude protein)
- Fatty acids: g/kg (as fed or dry matter basis) and to % of total fatty acids
- Digestible amino acids: g/kg (as fed or dry matter basis) and % (digestibility coefficient)
Energy values are presented both in kcal/kg and in MJ/kg.
Indicators of variability
- Standard deviations (SD), shown only when the number of observations is 5 or more
- Range: minimum and maximum
- Count: number of observations
-
Feed profiles
- Click here to access the feed profiles
The feed profiles displays the composition, nutritional values and environmental impact of a chosen feed.
- Data are shown on as fed basis, dry matter basis and on another basis (when relevant).
- Min/max, standard deviation and the number of observations can be displayed on demand.
- The profile can be filtered by Parameter category (Main constituents...).
Parameters profiles
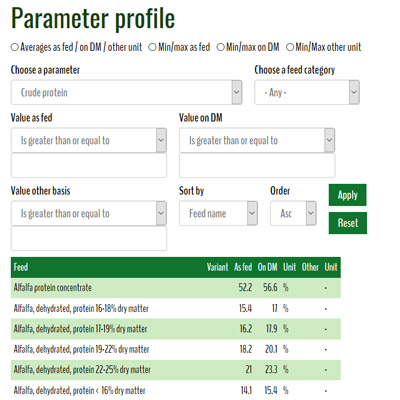
The parameter profile displays the data of a chosen parameter for all the feeds.
- Data are shown on as fed basis, dry matter basis and on another basis (when relevant).
- Min/max, standard deviation and the number of observations can be displayed on demand.
- The profile can be filtered by Feed category (Cereals...)
- The profile can be filtered by Value (as fed, dry matter and other):
- This can be used to display only feeds with more than 50% protein
Tables per categories
- Click here to access the tables per categories (as fed basis)
- Click here to access the tables per categories (dry matter basis)
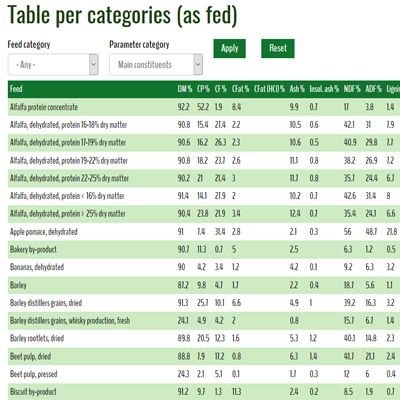
In this display, data are presented in tabular form, with feeds in rows and parameters in columns.
- Data are shown on an as fed basis or dry matter basis except for parameters where this basis is not relevant.
- The table can be filtered by Feed category (Cereals...) and by Parameter category (Amino acids...).


